Custom Configurations#
This page assumes you have already read the Basic Usage example. We will reuse the same ECG record from PTB-XL, but focus on configuring the layout and visual parameters of the plot rather than the data loading step.
import wfdb
import pandas as pd
import pmecg

record = wfdb.rdrecord('00001_hr', pn_dir='ptb-xl/1.0.3/records500/00000/')
ecg_df = pd.DataFrame(record.p_signal, columns=record.sig_name)
fs = record.fs
Customizing Speed and Voltage#
The ECGPlotter constructor accepts speed (mm/s) and voltage (mm/mV)
parameters that control the physical scale of the printed ECG.
The defaults match the most common clinical convention:
Parameter |
Default |
Typical alternatives |
|---|---|---|
|
25 mm/s |
50 mm/s (detail), 12.5 mm/s (overview) |
|
10 mm/mV |
5 mm/mV (tall R-waves), 20 mm/mV (low amplitude) |
# Double-speed plot — useful for inspecting narrow QRS complexes
plotter_fast = pmecg.ECGPlotter(speed=50.0, voltage=10.0)

fig = plotter_fast.plot(ecg_df, sampling_frequency=fs, show=True)
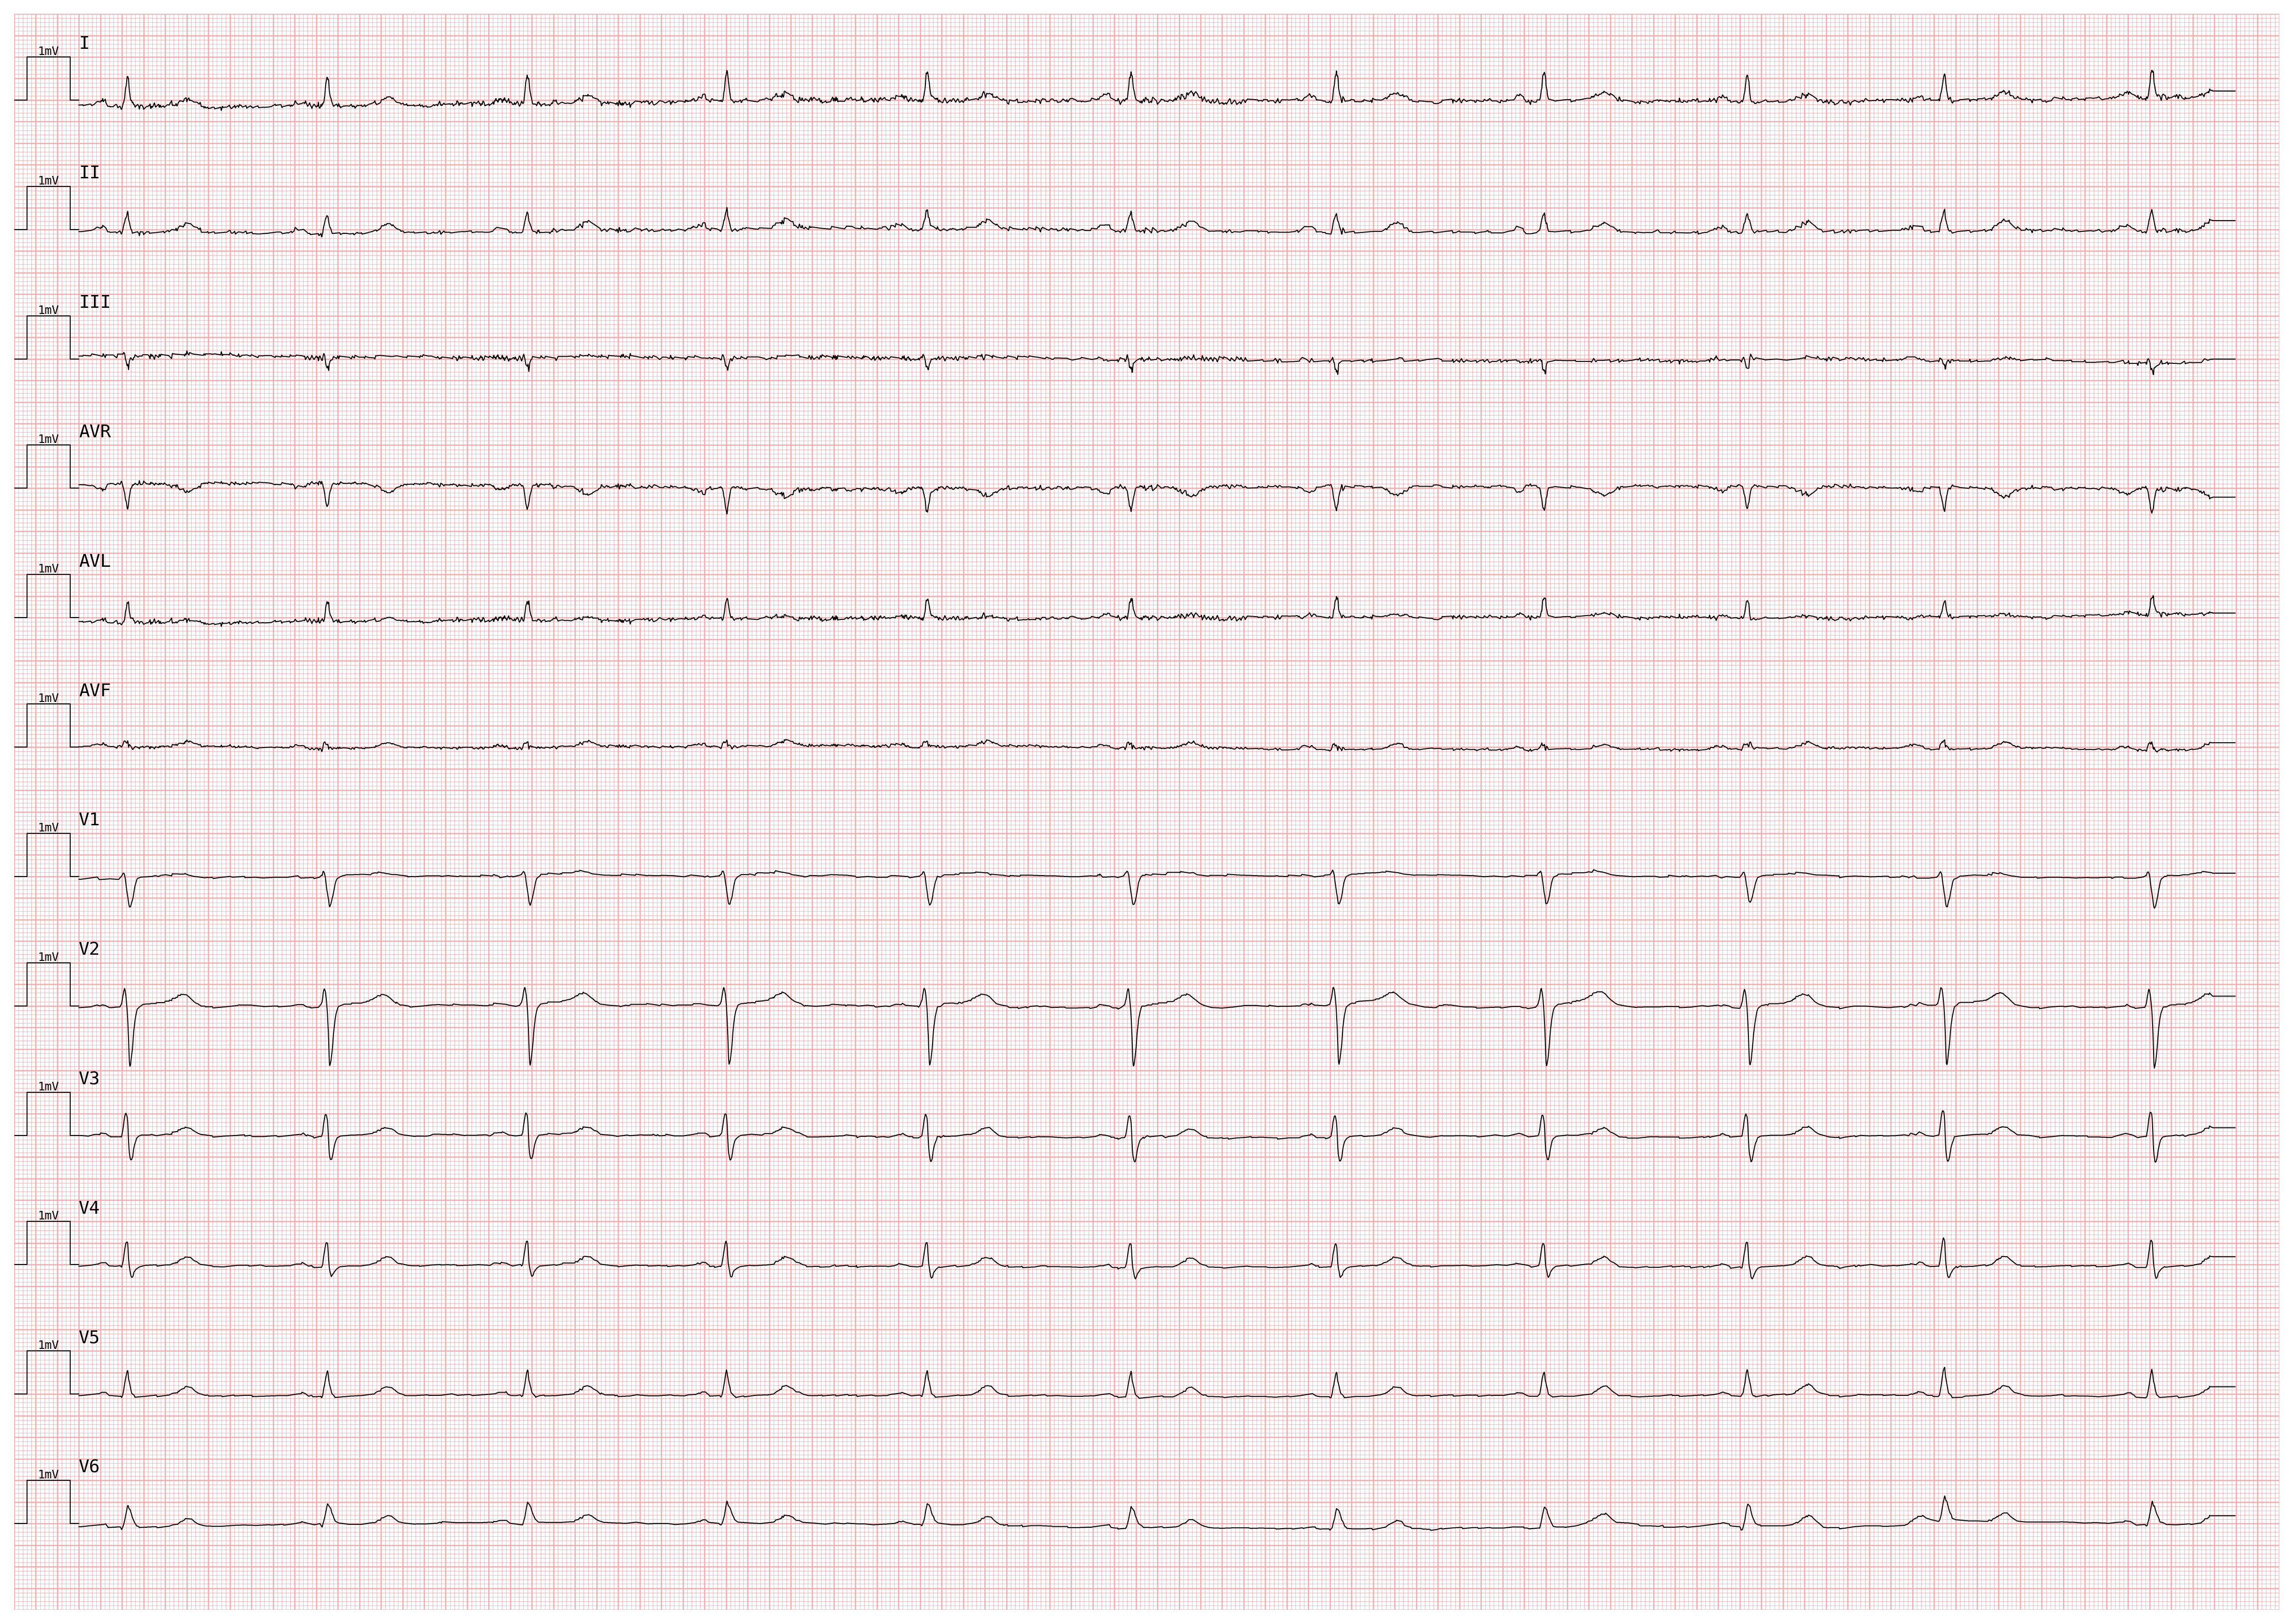
# High-voltage plot — useful when signals are low-amplitude
plotter_hv = pmecg.ECGPlotter(speed=25.0, voltage=20.0)

fig = plotter_hv.plot(ecg_df, sampling_frequency=fs, show=True)
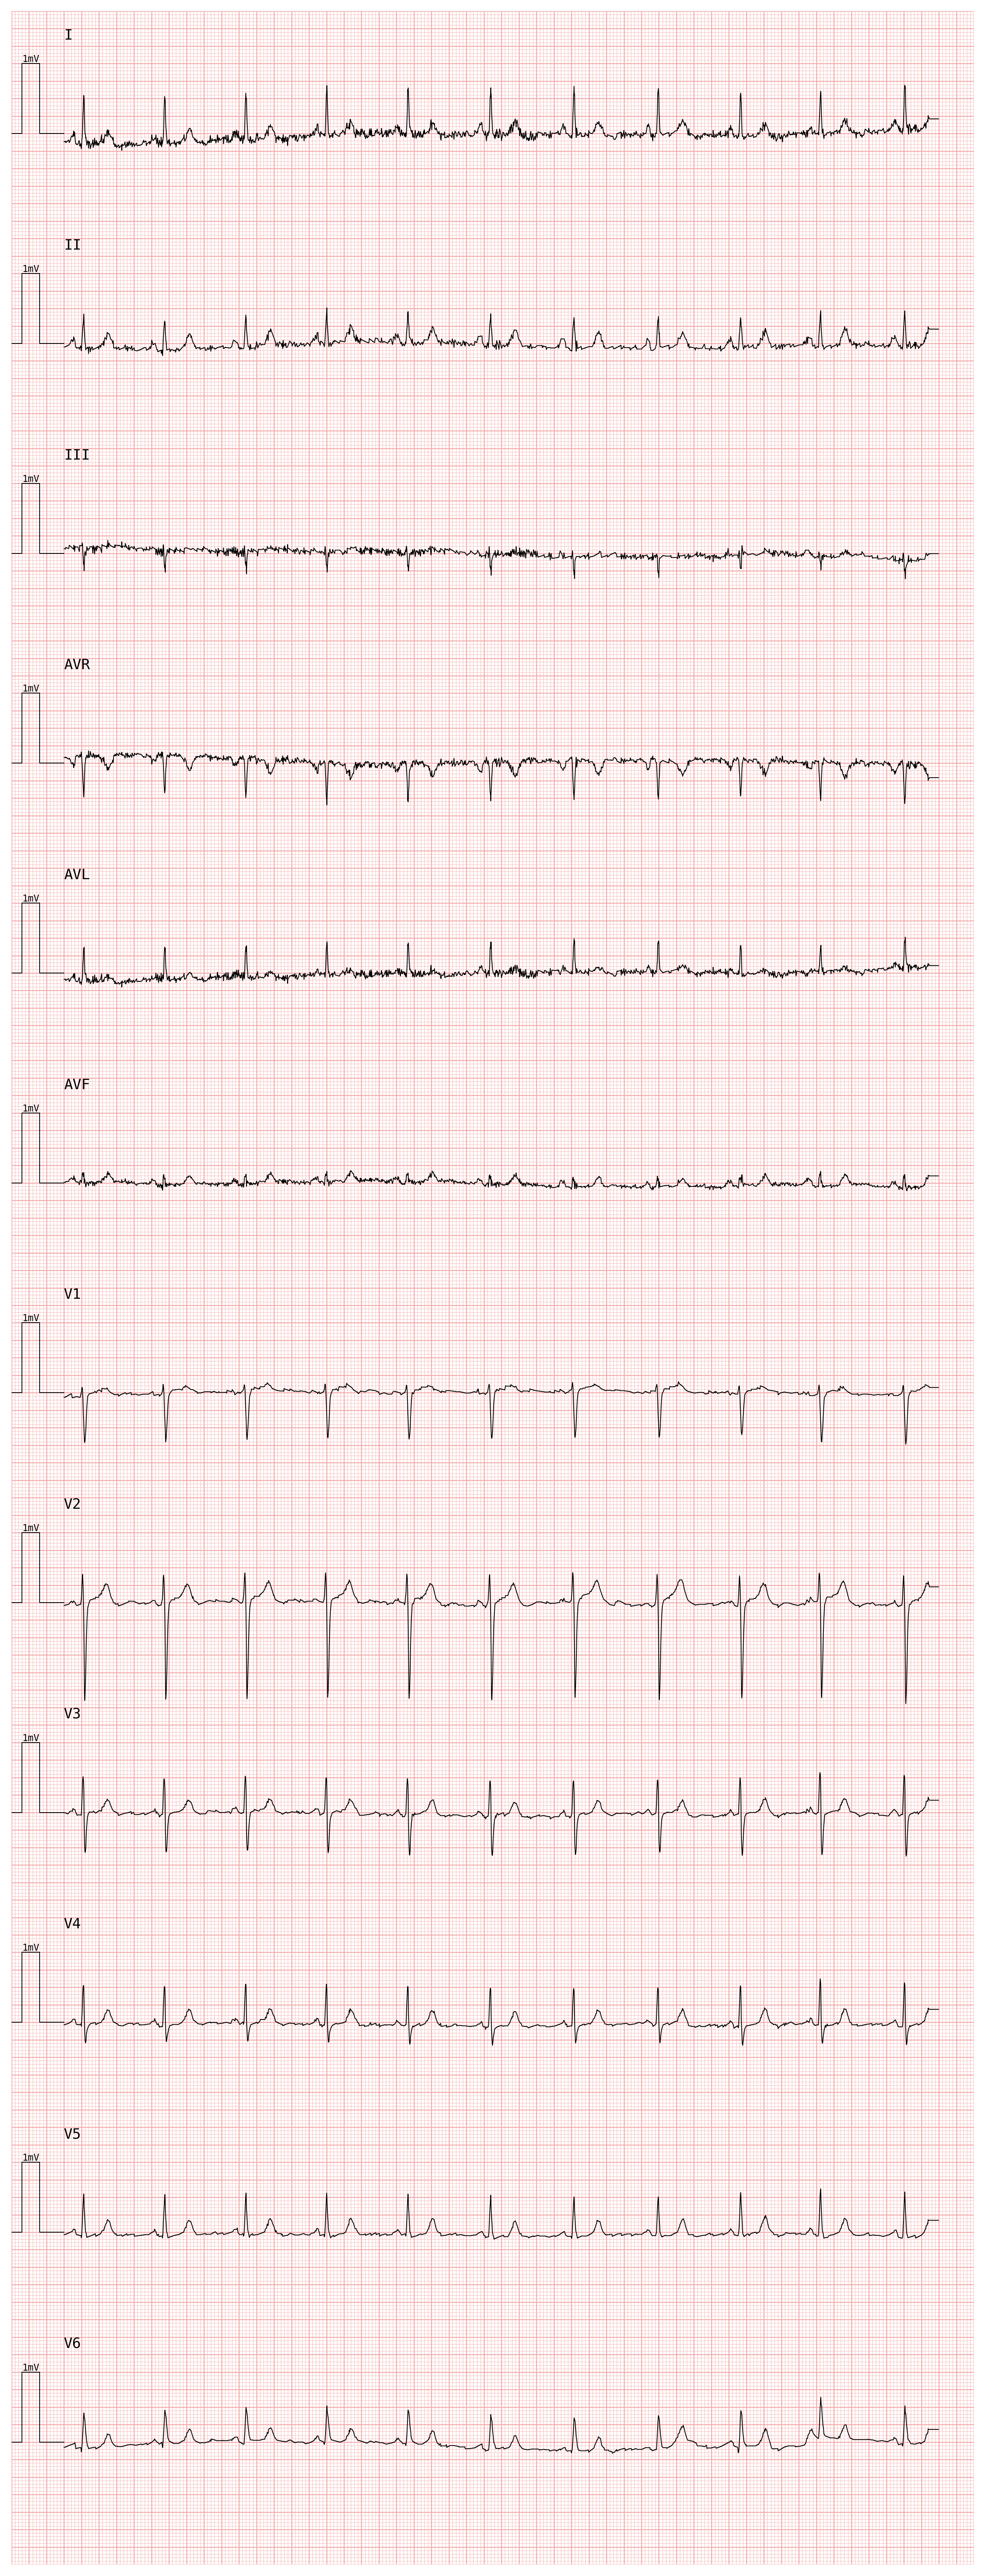
Other visual parameters you can set at construction time:
row_distance— vertical spacing between rows, in mV (default3.0)line_width— ECG trace thickness in points (default0.5)grid_color— any Matplotlib color string (default'#f4aaaa', light red)grid_mode—'cm'for the standard 1 mm / 5 mm grid, orNoneto disable
plotter_custom = pmecg.ECGPlotter(
    speed=25.0,
    voltage=10.0,
    row_distance=4.0,
    line_width=0.8,
    grid_color='lightgray',
)

fig = plotter_custom.plot(ecg_df, sampling_frequency=fs, show=True)
Using template_factory#
Instead of specifying a layout row-by-row, you can use one of the built-in named templates. The supported templates are:
Template |
Leads |
|---|---|
|
I |
|
I, II |
|
I, II, V2 |
|
I, II, III, V2 |
|
I, II, III, aVR, aVL, aVF |
|
I, II, V1, V2, V3, V4, V5, V6 |
|
I, II, III, aVR, aVL, aVF, V1, V2, V3, V4, V5, V6 |
|
4 rows with two concurrent leads |
|
6 rows with two concurrent leads |
|
3 rows with four concurrent leads |
|
4 rows with two concurrent leads + lead II rhythm strip |
|
6 rows with two concurrent leads + lead II rhythm strip |
|
3 rows with four concurrent leads + lead II rhythm strip |
|
4 rows with two concurrent leads + II, V1, V5 rhythm strips |
|
6 rows with two concurrent leads + II, V1, V5 rhythm strips |
|
3 rows with four concurrent leads + II, V1, V5 rhythm strips |
Because a template uses canonical lead names ("I", "II", …, "V6") while
your input DataFrame may use different column names, you must first call
pmecg.template_factory to expand the template into an explicit
ConfigurationDataType that references your actual columns.
PTB-XL records use uppercase "AVR", "AVL", "AVF" for the augmented limb
leads, while pmecg’s canonical names are "aVR", "aVL", "aVF". Pass a
LeadsMap to bridge the difference:
from pmecg import template_factory, LeadsMap
# Map the three PTB-XL uppercase column names to their canonical forms
ptbxl_map = LeadsMap(aVR="AVR", aVL="AVL", aVF="AVF")
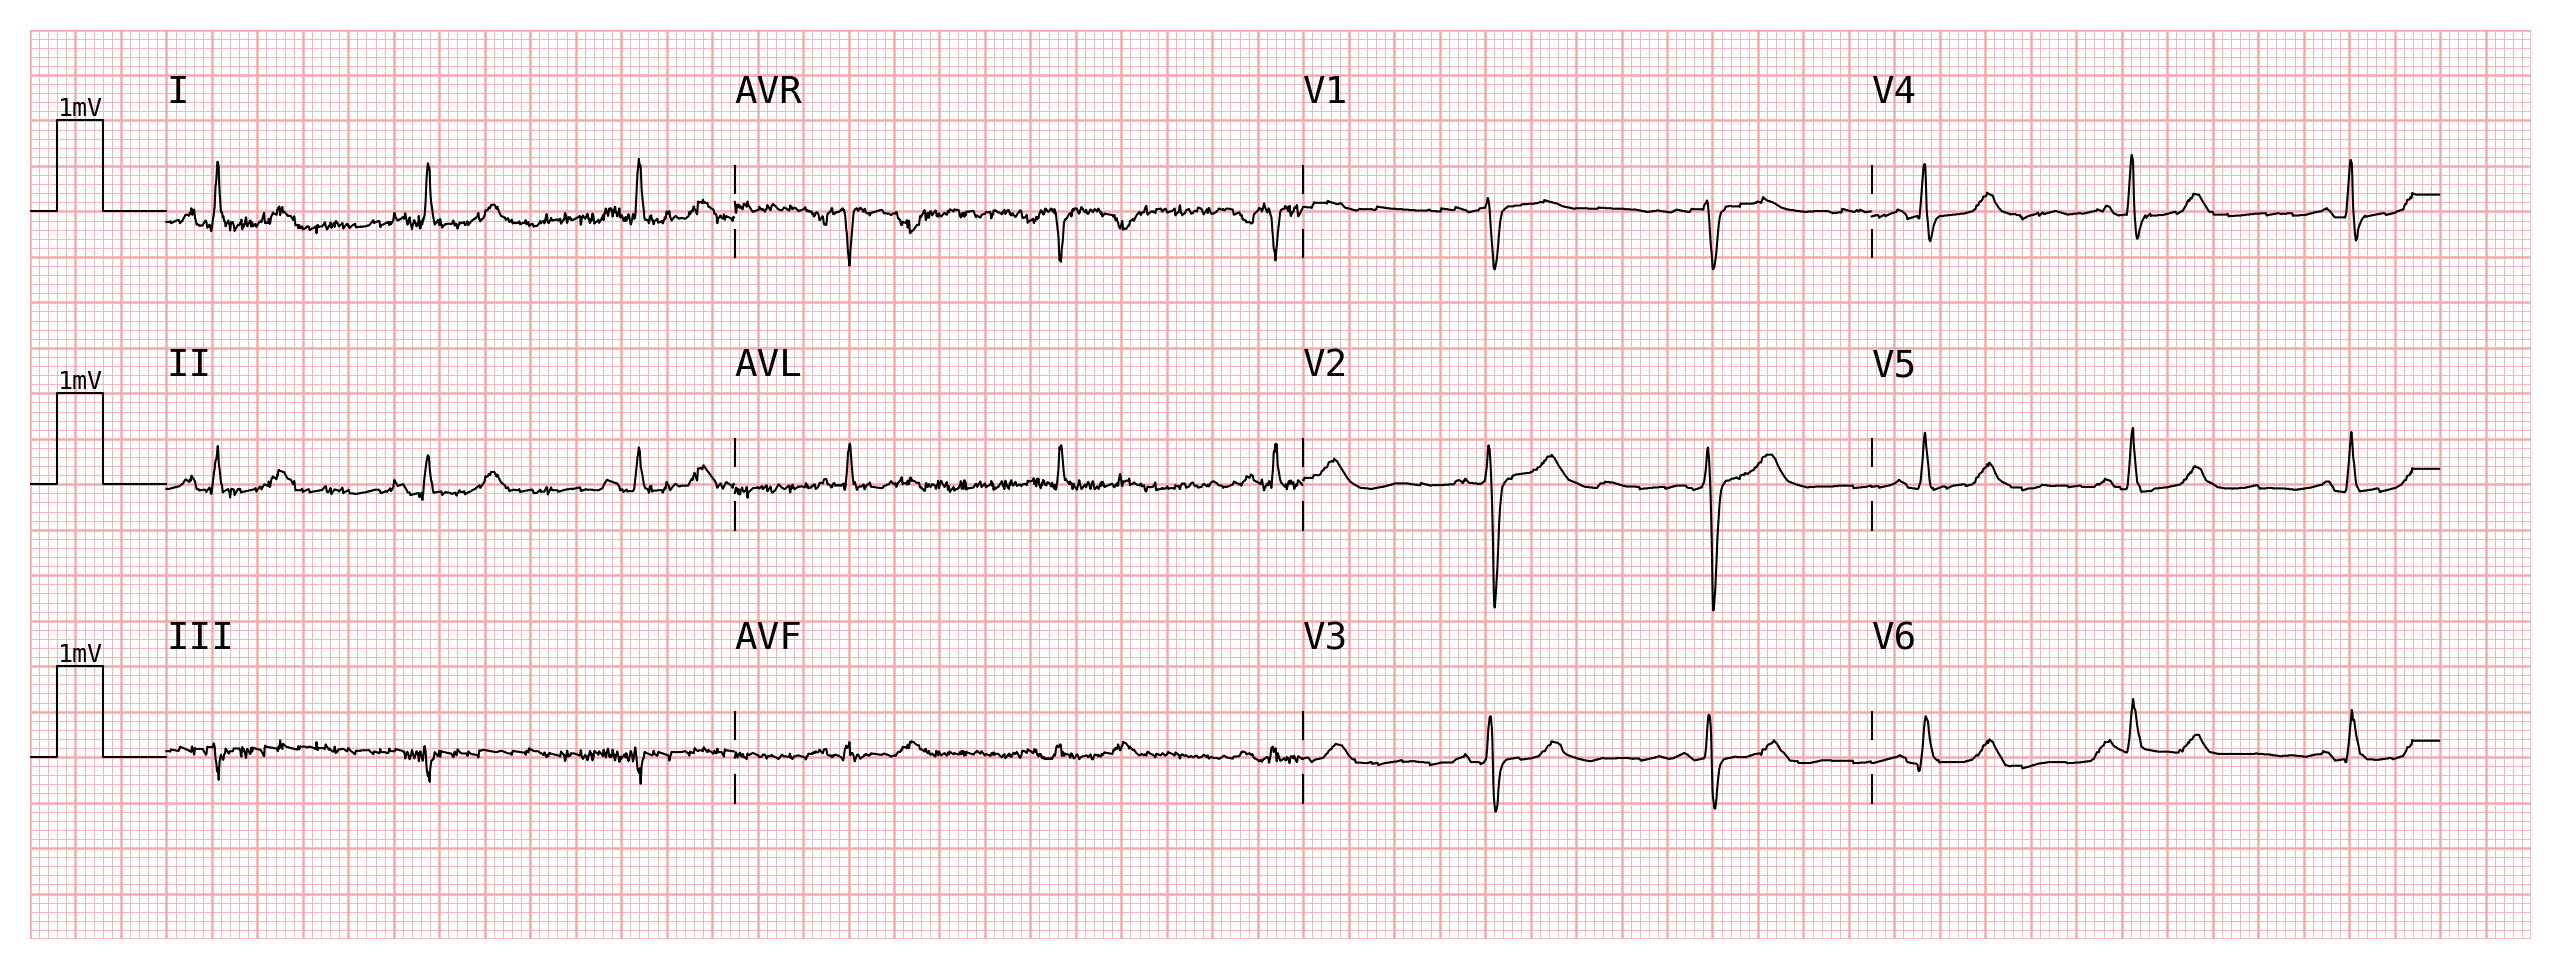
# Expand the standard 12-lead template
configuration = template_factory('4x3', ecg_df, leads_map=ptbxl_map)
print(configuration)
[['I', 'AVR', 'V1', 'V4'], ['II', 'AVL', 'V2', 'V5'], ['III', 'AVF', 'V3', 'V6']]
The result is a plain list that can be inspected and passed directly to
plotter.plot():
plotter = pmecg.ECGPlotter(grid_mode='cm')
fig = plotter.plot(ecg_df, configuration=configuration, sampling_frequency=fs, show=True)
Custom Lead Names with LeadsMap and template_factory#
If your ECG data uses non-canonical column names, use pmecg.LeadsMap to tell
template_factory which input column corresponds to each canonical lead.
# Suppose the input DataFrame uses a different naming convention
ecg_custom = ecg_df.rename(columns={
    'I':   'lead_I',
    'II':  'lead_II',
    'III': 'lead_III',
    'AVR': '-aVR',   # PTB-XL "AVR" → custom column named '-aVR'
    'AVL': 'lead_AVL',
    'AVF': 'lead_AVF',
    'V1':  'chest_1',
    'V2':  'chest_2',
    'V3':  'chest_3',
    'V4':  'chest_4',
    'V5':  'chest_5',
    'V6':  'chest_6',
})

ecg_custom.head()
| lead_I | lead_II | lead_III | -aVR | lead_AVL | lead_AVF | chest_1 | chest_2 | chest_3 | chest_4 | chest_5 | chest_6 | |
|---|---|---|---|---|---|---|---|---|---|---|---|---|
| 0 | -0.115 | -0.05 | 0.065 | 0.082 | -0.09 | 0.007 | -0.065 | -0.04 | -0.005 | -0.035 | -0.035 | -0.075 |
| 1 | -0.115 | -0.05 | 0.065 | 0.082 | -0.09 | 0.007 | -0.065 | -0.04 | -0.005 | -0.035 | -0.035 | -0.075 |
| 2 | -0.115 | -0.05 | 0.065 | 0.082 | -0.09 | 0.007 | -0.065 | -0.04 | -0.005 | -0.035 | -0.035 | -0.075 |
| 3 | -0.115 | -0.05 | 0.065 | 0.082 | -0.09 | 0.007 | -0.065 | -0.04 | -0.005 | -0.035 | -0.035 | -0.075 |
| 4 | -0.115 | -0.05 | 0.065 | 0.082 | -0.09 | 0.007 | -0.065 | -0.04 | -0.005 | -0.035 | -0.035 | -0.075 |
Build a LeadsMap that maps each canonical name to the corresponding column
in ecg_custom, then pass it to template_factory:
leads_map = pmecg.LeadsMap(
I='lead_I',
II='lead_II',
III='lead_III',
aVR='-aVR',
aVL='lead_AVL',
aVF='lead_AVF',
V1='chest_1',
V2='chest_2',
V3='chest_3',
V4='chest_4',
V5='chest_5',
V6='chest_6',
)
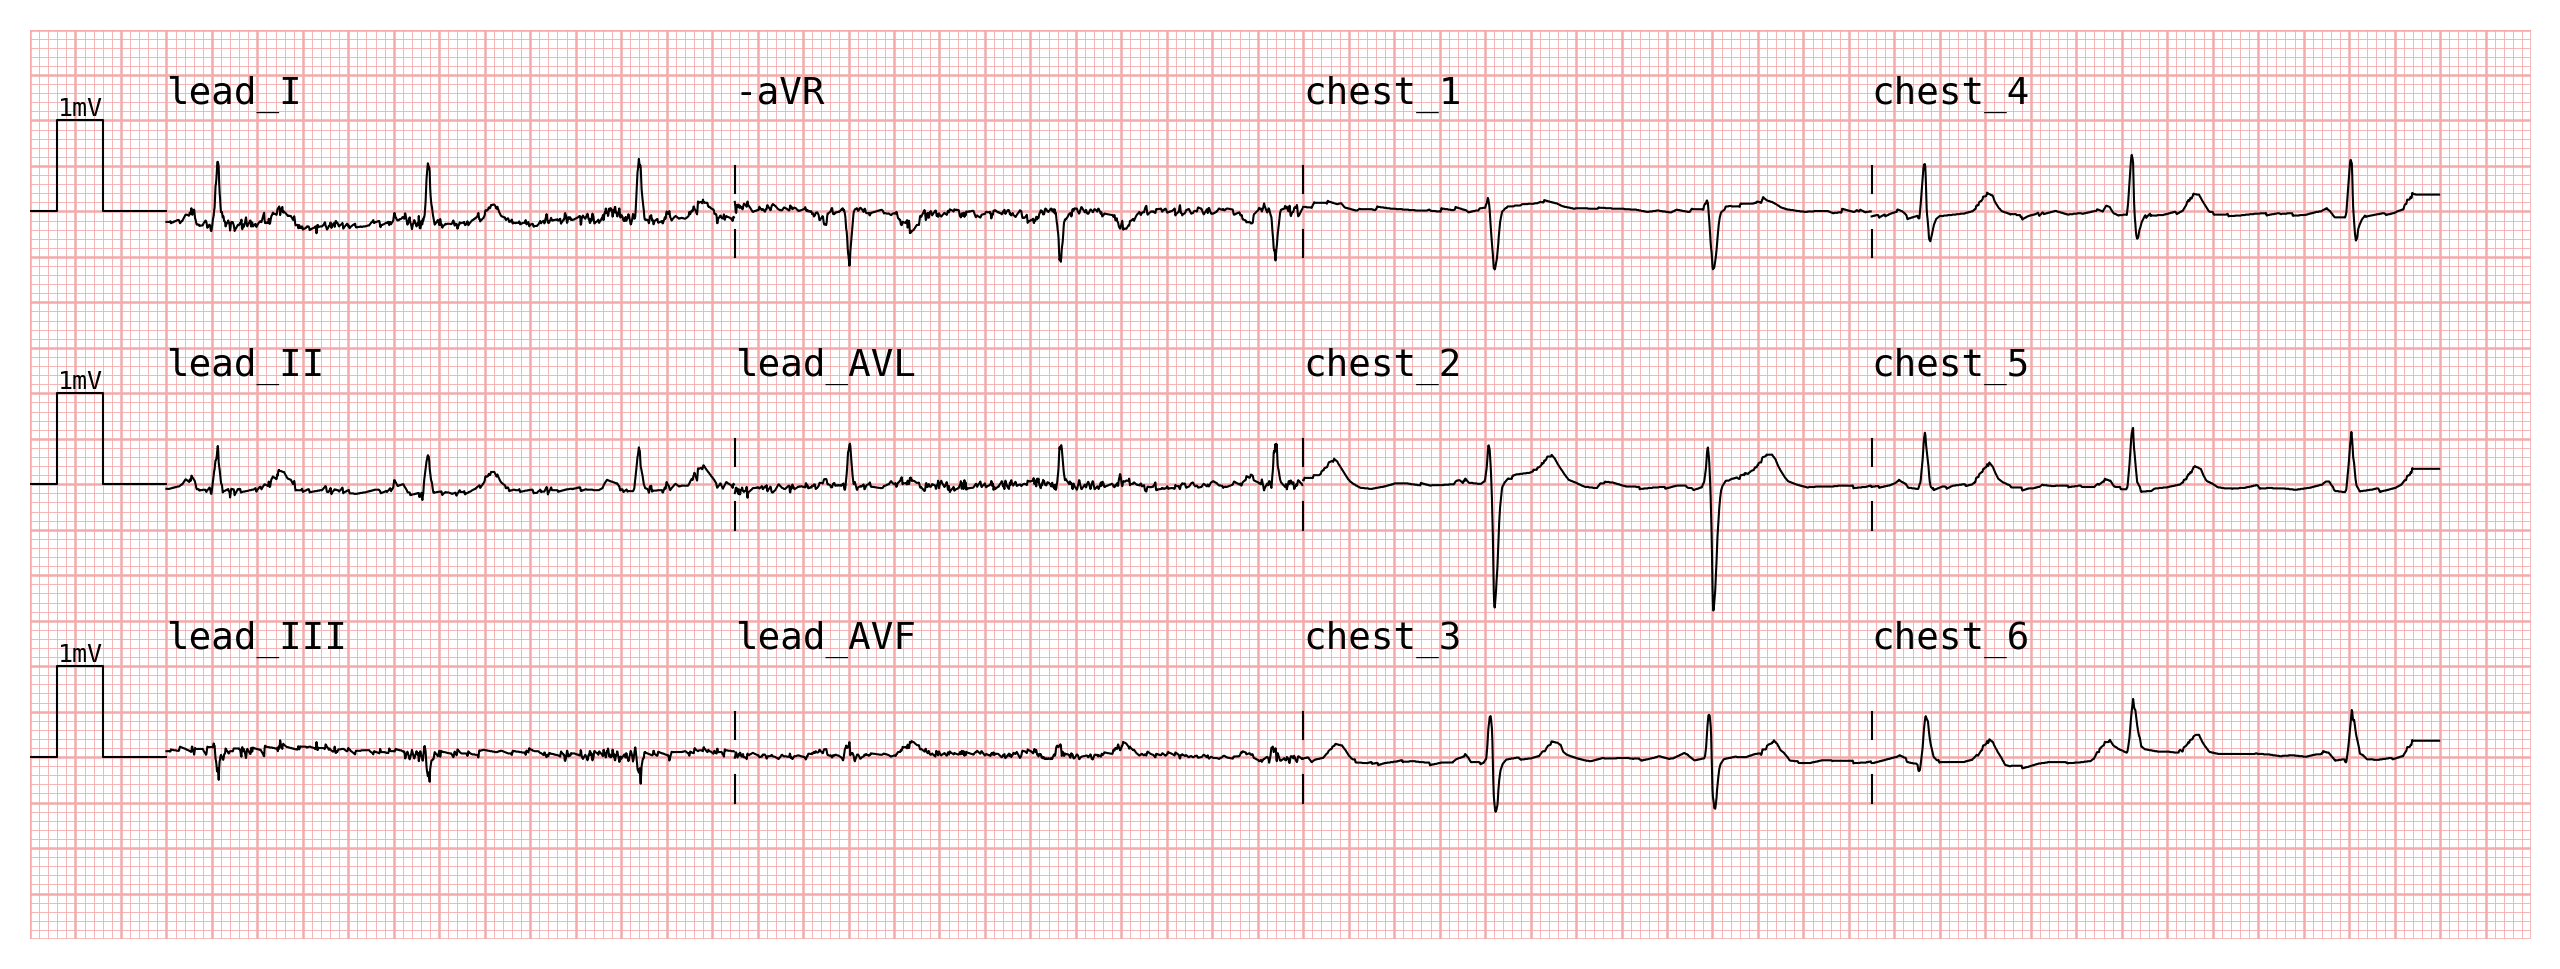
configuration = template_factory('4x3', ecg_custom, leads_map=leads_map)
print(configuration)
[['lead_I', '-aVR', 'chest_1', 'chest_4'], ['lead_II', 'lead_AVL', 'chest_2', 'chest_5'], ['lead_III', 'lead_AVF', 'chest_3', 'chest_6']]
The configuration now contains your custom column names, and can be passed
directly to plot():
plotter = pmecg.ECGPlotter(grid_mode='cm')
fig = plotter.plot(ecg_custom, configuration=configuration, sampling_frequency=fs, show=True)
Custom Lead Names with a Custom Configuration#
When the built-in templates do not match the layout you need, you can build a
ConfigurationDataType manually. Each element of the list represents one row:
A
str→ that lead is plotted full-width for the entire recording duration.A
list[str]→ those leads are concatenated side-by-side within the row.
The list elements reference your input column names directly, so no LeadsMap
is needed:
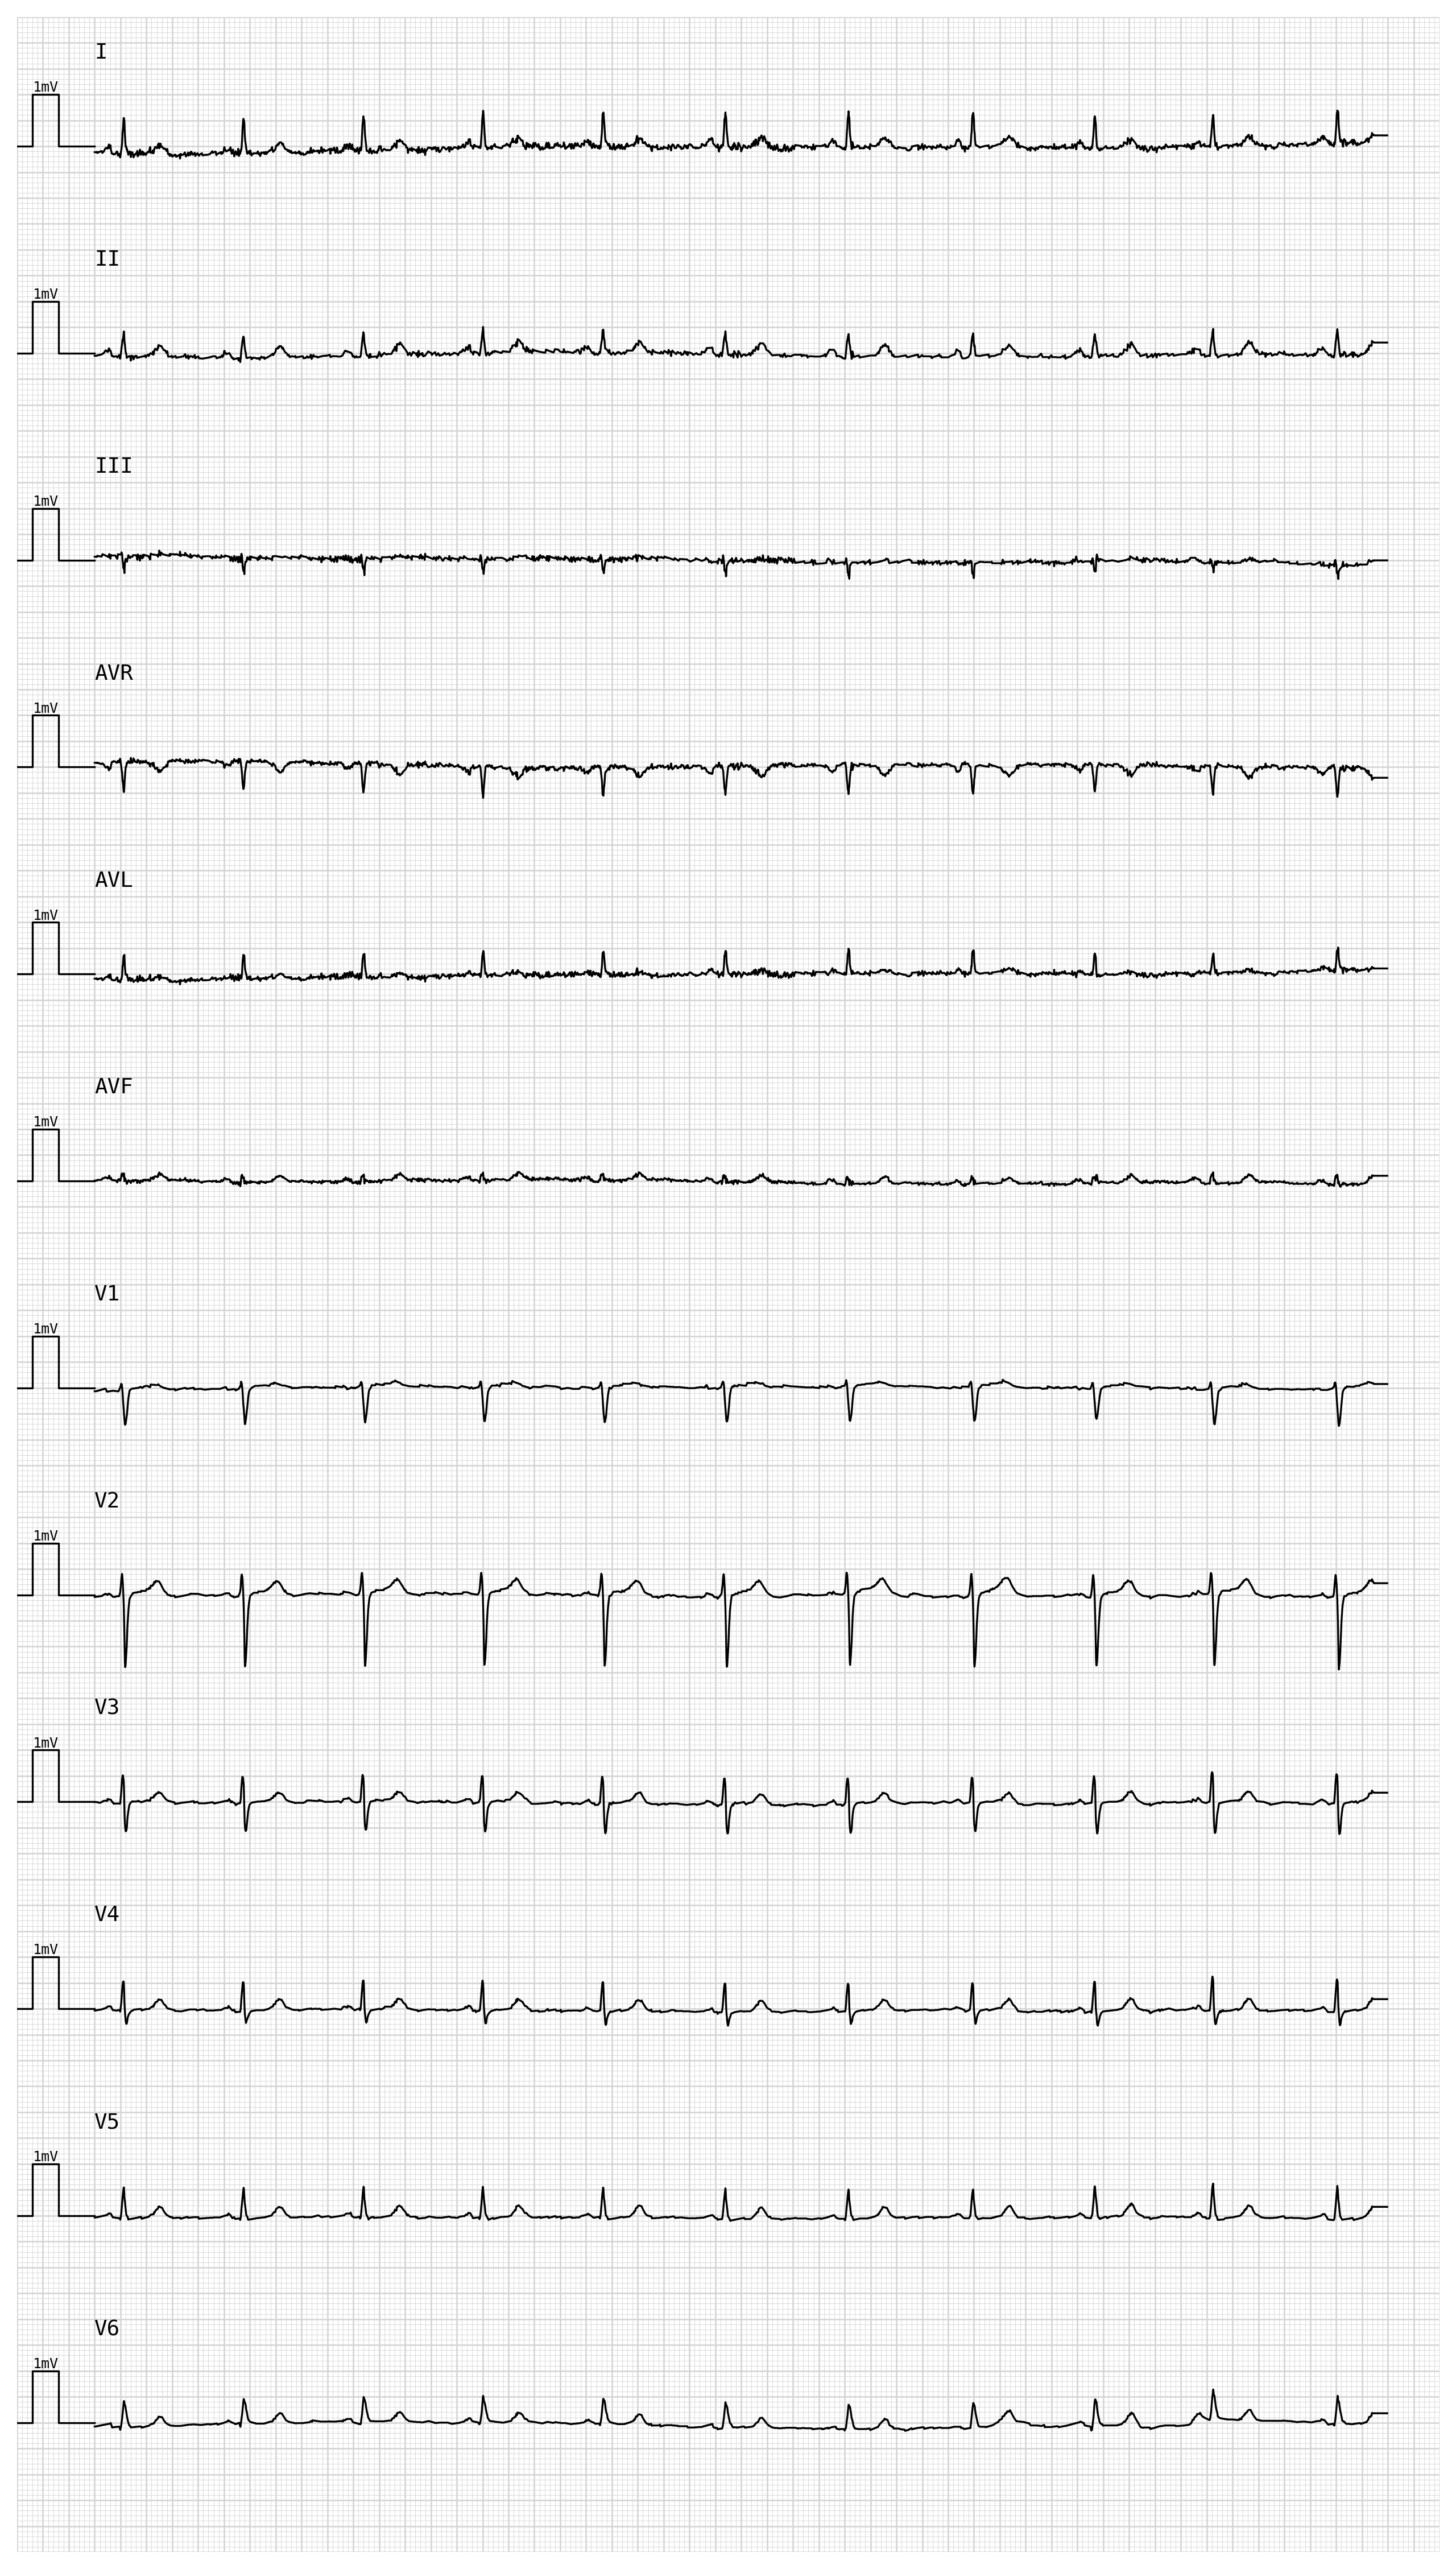
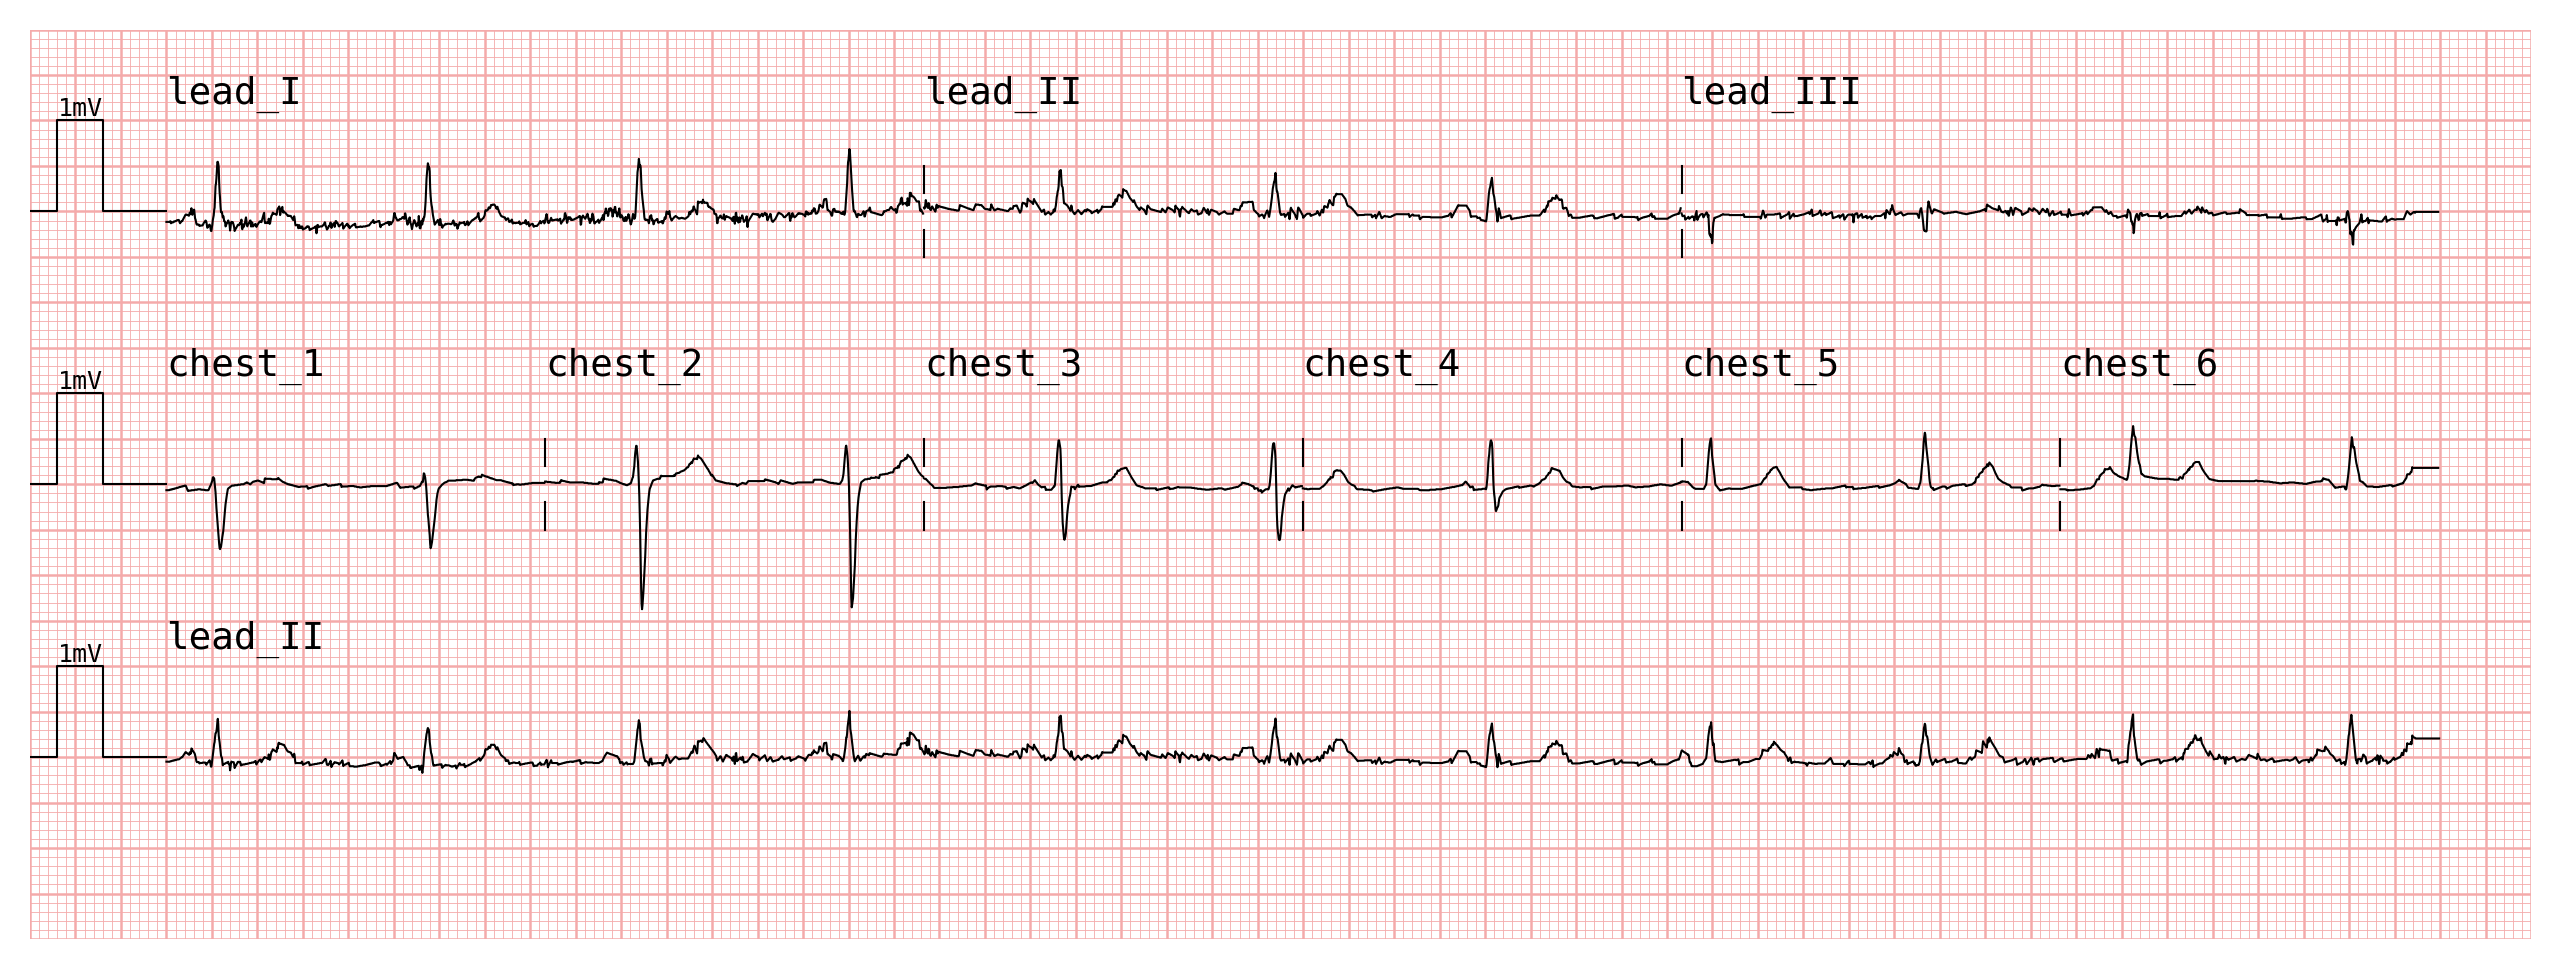
# A bespoke layout: limb leads on the first row, precordial on the second,
# followed by a full-width rhythm strip
custom_configuration = [
    ['lead_I', 'lead_II', 'lead_III'],          # row 1: limb leads
    ['chest_1', 'chest_2', 'chest_3',
     'chest_4', 'chest_5', 'chest_6'],           # row 2: precordial leads
    'lead_II',                                   # row 3: rhythm strip
]

plotter = pmecg.ECGPlotter(grid_mode='cm', print_information=False)
fig = plotter.plot(ecg_custom, configuration=custom_configuration, sampling_frequency=fs, show=True)
/home/docs/checkouts/readthedocs.org/user_builds/pmecg/checkouts/stable/src/pmecg/plot.py:299: UserWarning: total_samples (5000) is not evenly divisible by the number of selected leads (3). The last few samples will not be plotted.
  config_rows = _apply_configuration(df_data, resolved_configuration, self.disconnect_segments)
/home/docs/checkouts/readthedocs.org/user_builds/pmecg/checkouts/stable/src/pmecg/plot.py:299: UserWarning: total_samples (5000) is not evenly divisible by the number of selected leads (6). The last few samples will not be plotted.
  config_rows = _apply_configuration(df_data, resolved_configuration, self.disconnect_segments)
Note
Lead name matching is exact and case-sensitive. "v1" and "V1" are treated
as two distinct names. Make sure the strings in your configuration match the
column names in your DataFrame exactly.