Cabrera format#
In this page, we will show how to plot ECGs in the Cabrera format. This ECG presentation is particularly popular in Sweden, see this article.
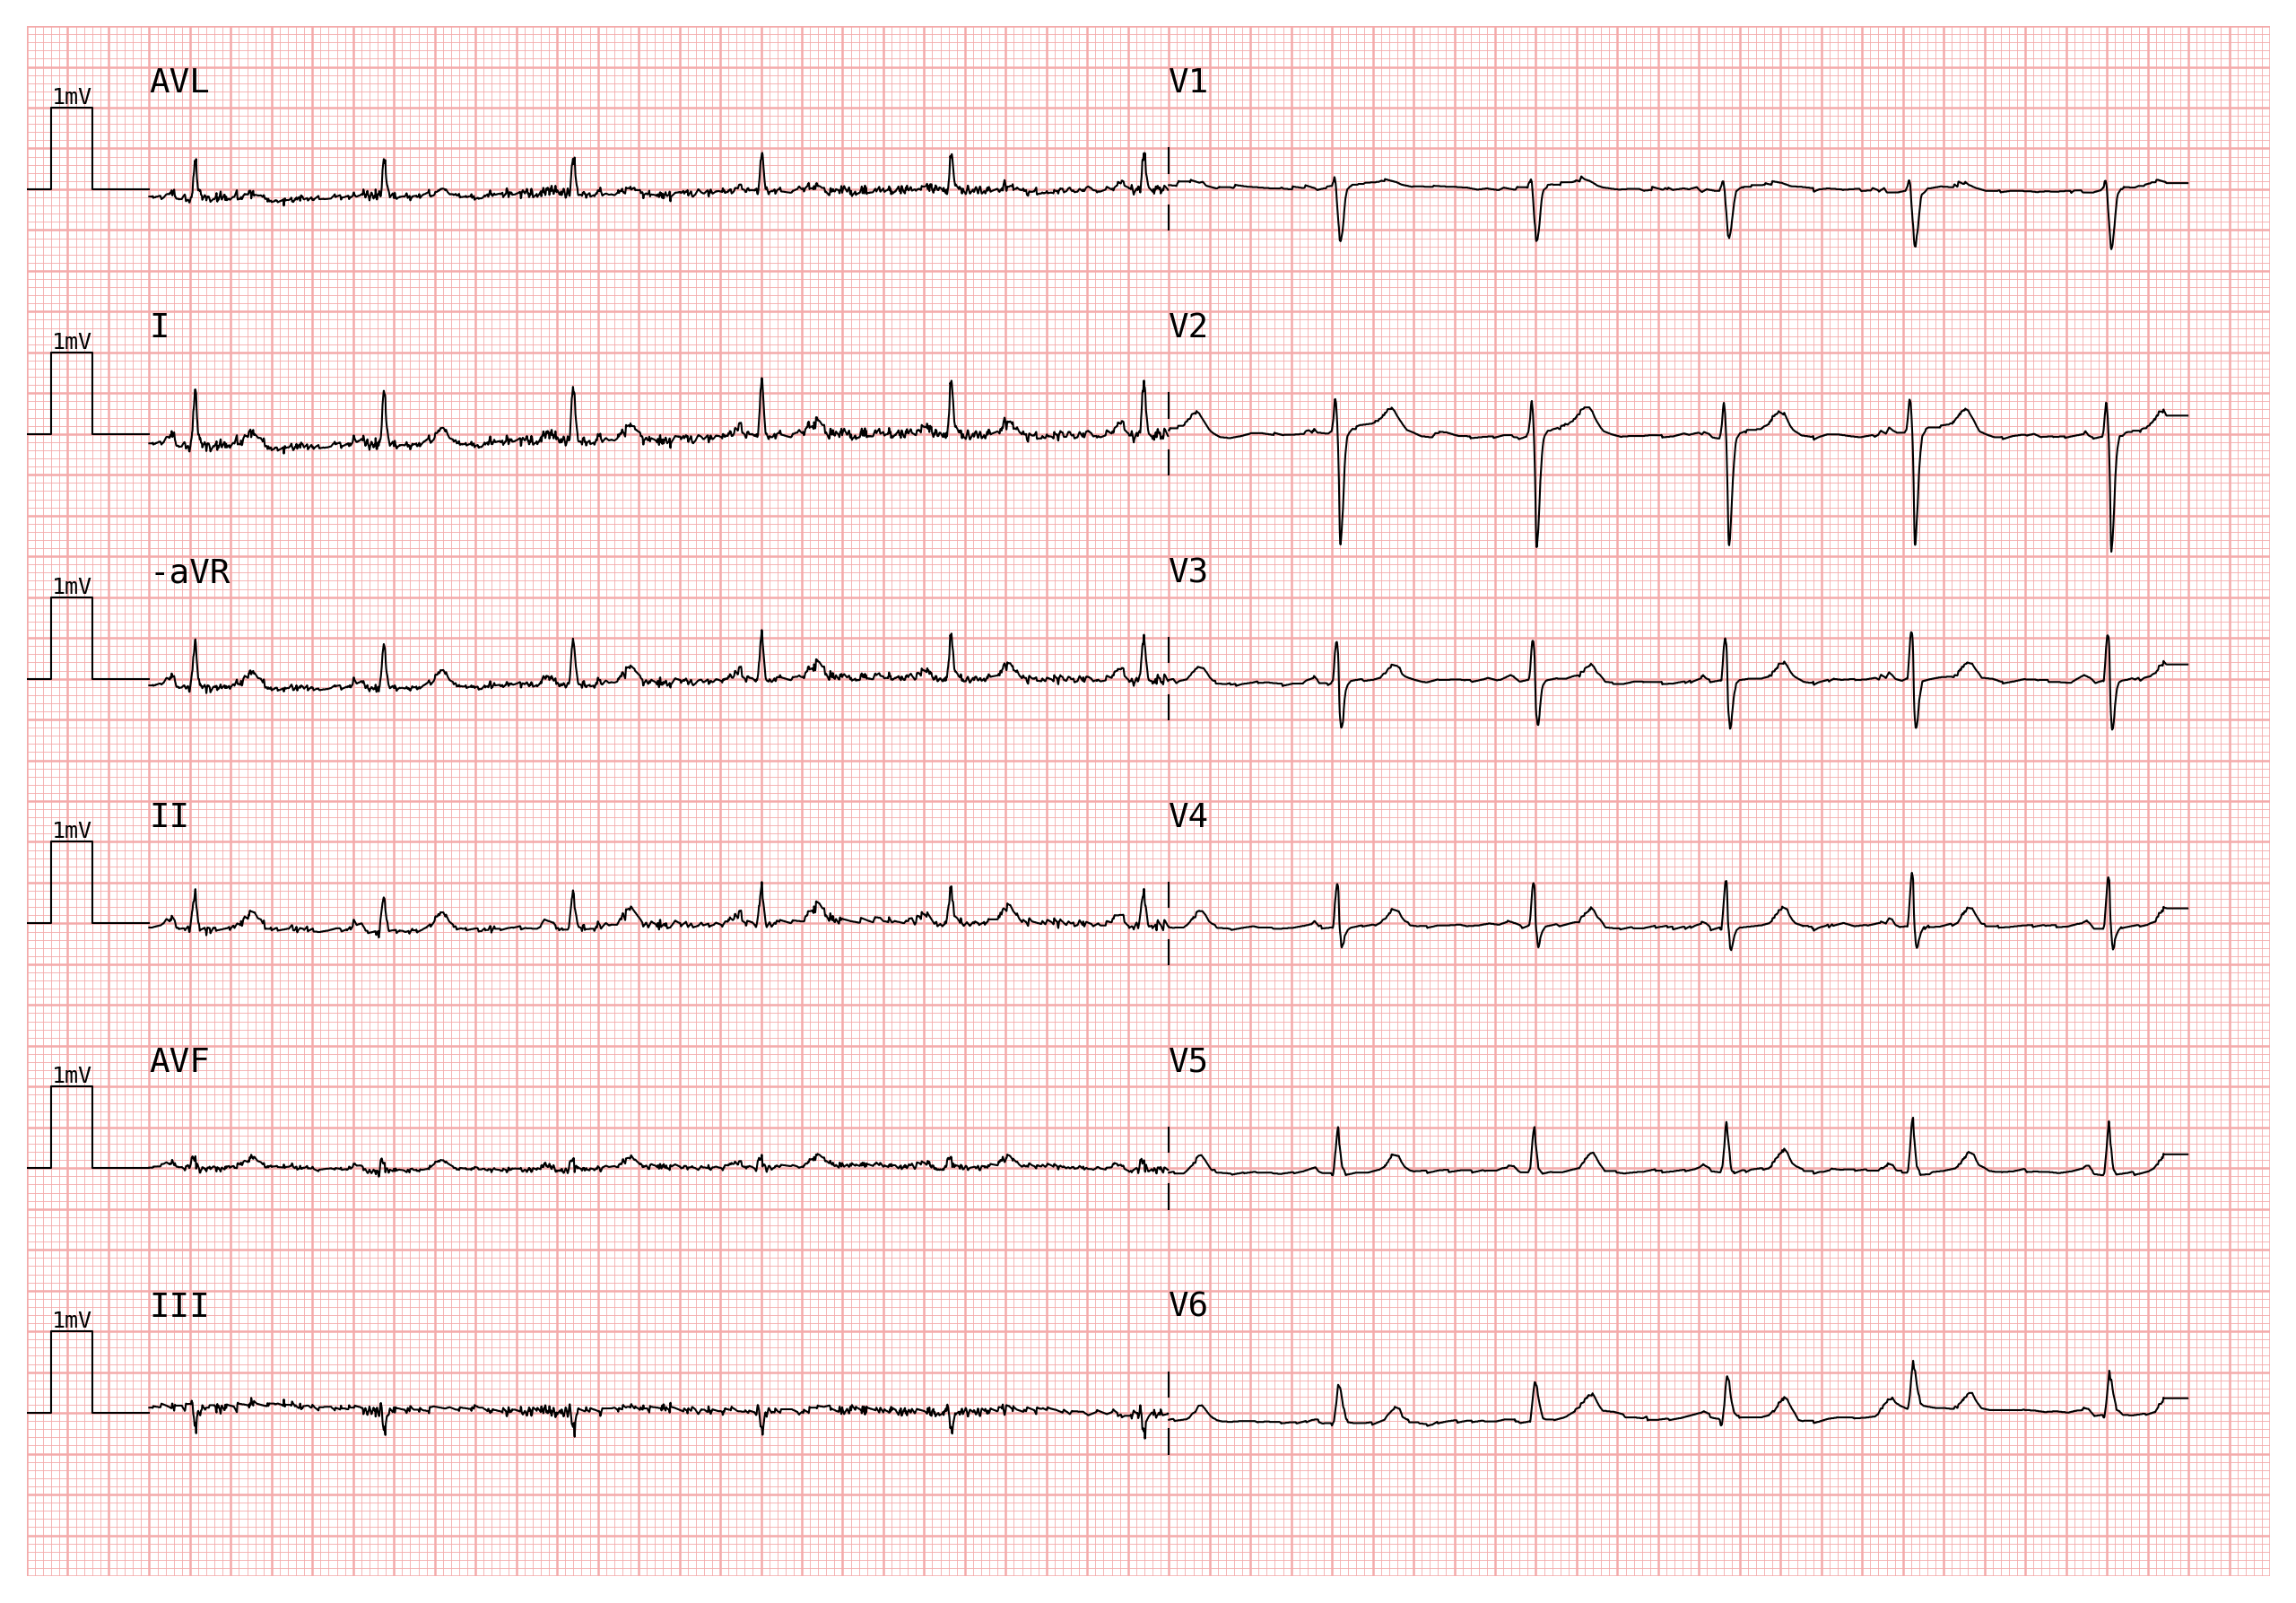
Cabrera format reorders the six limb leads as aVL → I → −aVR → II → aVF → III (instead of the standard I → II → III → aVR → aVL → aVF) and replaces the aVR lead with its inverse (−aVR). This arrangement places leads in a continuous clockwise sequence around the frontal plane, making axis deviations and ischaemic patterns easier to spot.
Let’s start off by importing a PTB-XL ECG:
import wfdb
import pandas as pd
import numpy as np
import pmecg

record = wfdb.rdrecord('00001_hr', pn_dir='ptb-xl/1.0.3/records500/00000/')
ecg_df = pd.DataFrame(record.p_signal, columns=record.sig_name)
fs = record.fs
There are two ways to plot an ECG in the Cabrera format - we will explore both of them.
Approach 1. Use pmecg.cabrera_factory#
cabrera_factory is a convenience function that:
Inverts the column aVR, and renames it to -aVR
Converts a canonical template (built via
template_factory) into the Cabrera layout
from pmecg import cabrera_factory, LeadsMap

# PTB-XL uses uppercase "AVR"/"AVL"/"AVF"; map them to canonical "aVR"/"aVL"/"aVF"
ptbxl_map = LeadsMap(aVR="AVR", aVL="AVL", aVF="AVF")

cabrera_data, cabrera_config = cabrera_factory('2x6', ecg_df, leads_map=ptbxl_map)
print(cabrera_config)
[['AVL', 'V1'], ['I', 'V2'], ['-aVR', 'V3'], ['II', 'V4'], ['AVF', 'V5'], ['III', 'V6']]
Pass both directly to plot():
plotter = pmecg.ECGPlotter(grid_mode='cm')
fig = plotter.plot(cabrera_data, configuration=cabrera_config, sampling_frequency=fs, show=True)
Note
cabrera_factory supports all templates that include all six limb leads:
'1x6', '1x12', '2x6', '4x3', '2x6+1', '4x3+1', '2x6+3', and
'4x3+3'. Rhythm-strip rows (bare string entries in multi-row templates like
'2x6+1') are preserved unchanged.
Warning
If your leads_map maps aVR to a name starting with '-'
(e.g. LeadsMap(aVR='-aVR')), cabrera_factory assumes the column has already been negated and skips the sign flip. If the column is not actually pre-negated, the plot will be incorrect.
Approach 2. Manual#
The same result can be achieved by manually changing the sign of the aVR column and passing a custom configuration to ECGPlotter.plot():
cabrera_df = ecg_df.copy()
cabrera_df['-aVR'] = - cabrera_df['AVR']   # PTB-XL column is 'AVR'
cabrera_df = cabrera_df.drop(columns=['AVR'])

config = [['AVL', 'V1'],   # PTB-XL column names for aVL/aVF are still uppercase here
         ['I', 'V2'],
         ['-aVR', 'V3'],   # our newly created negated column
         ['II', 'V4'],
         ['AVF', 'V5'],
         ['III', 'V6']]

fig = plotter.plot(cabrera_df, configuration=config, sampling_frequency=fs, show=True)