Basic Usage#
We start off by reading the electrocardiogram with id=1 from PTB-XL.
To do so, we use the wfdb Python package.
Note
The patient information and the ECG annotations are stored in the ptbxl_database.csv file.
The ECG features are available in the PTB-XL+ dataset. The code below downloads the record directly from PhysioNet using wfdb, which requires network access.
import wfdb
import pandas as pd

record = wfdb.rdrecord('00001_hr', pn_dir='ptb-xl/1.0.3/records500/00000/')

# record.p_signal contains the ECG data with shape (seq_len, n_leads)
# record.sig_name contains the lead names
ecg_df = pd.DataFrame(record.p_signal, columns=record.sig_name)
ecg_df.head()
| I | II | III | AVR | AVL | AVF | V1 | V2 | V3 | V4 | V5 | V6 | |
|---|---|---|---|---|---|---|---|---|---|---|---|---|
| 0 | -0.115 | -0.05 | 0.065 | 0.082 | -0.09 | 0.007 | -0.065 | -0.04 | -0.005 | -0.035 | -0.035 | -0.075 |
| 1 | -0.115 | -0.05 | 0.065 | 0.082 | -0.09 | 0.007 | -0.065 | -0.04 | -0.005 | -0.035 | -0.035 | -0.075 |
| 2 | -0.115 | -0.05 | 0.065 | 0.082 | -0.09 | 0.007 | -0.065 | -0.04 | -0.005 | -0.035 | -0.035 | -0.075 |
| 3 | -0.115 | -0.05 | 0.065 | 0.082 | -0.09 | 0.007 | -0.065 | -0.04 | -0.005 | -0.035 | -0.035 | -0.075 |
| 4 | -0.115 | -0.05 | 0.065 | 0.082 | -0.09 | 0.007 | -0.065 | -0.04 | -0.005 | -0.035 | -0.035 | -0.075 |
We now have a pandas DataFrame where each column contains all the sampled signal of each lead. Note that the column names match the canonical lead names:
Limb leads: “I”, “II”, “III”
AV leads: “AVR”, “AVL”, “AVF” (note: PTB-XL uses uppercase; canonical names are “aVR”, “aVL”, “aVF”)
Precordial leads: “V1”, “V2”, “V3”, “V4”, “V5”, “V6”
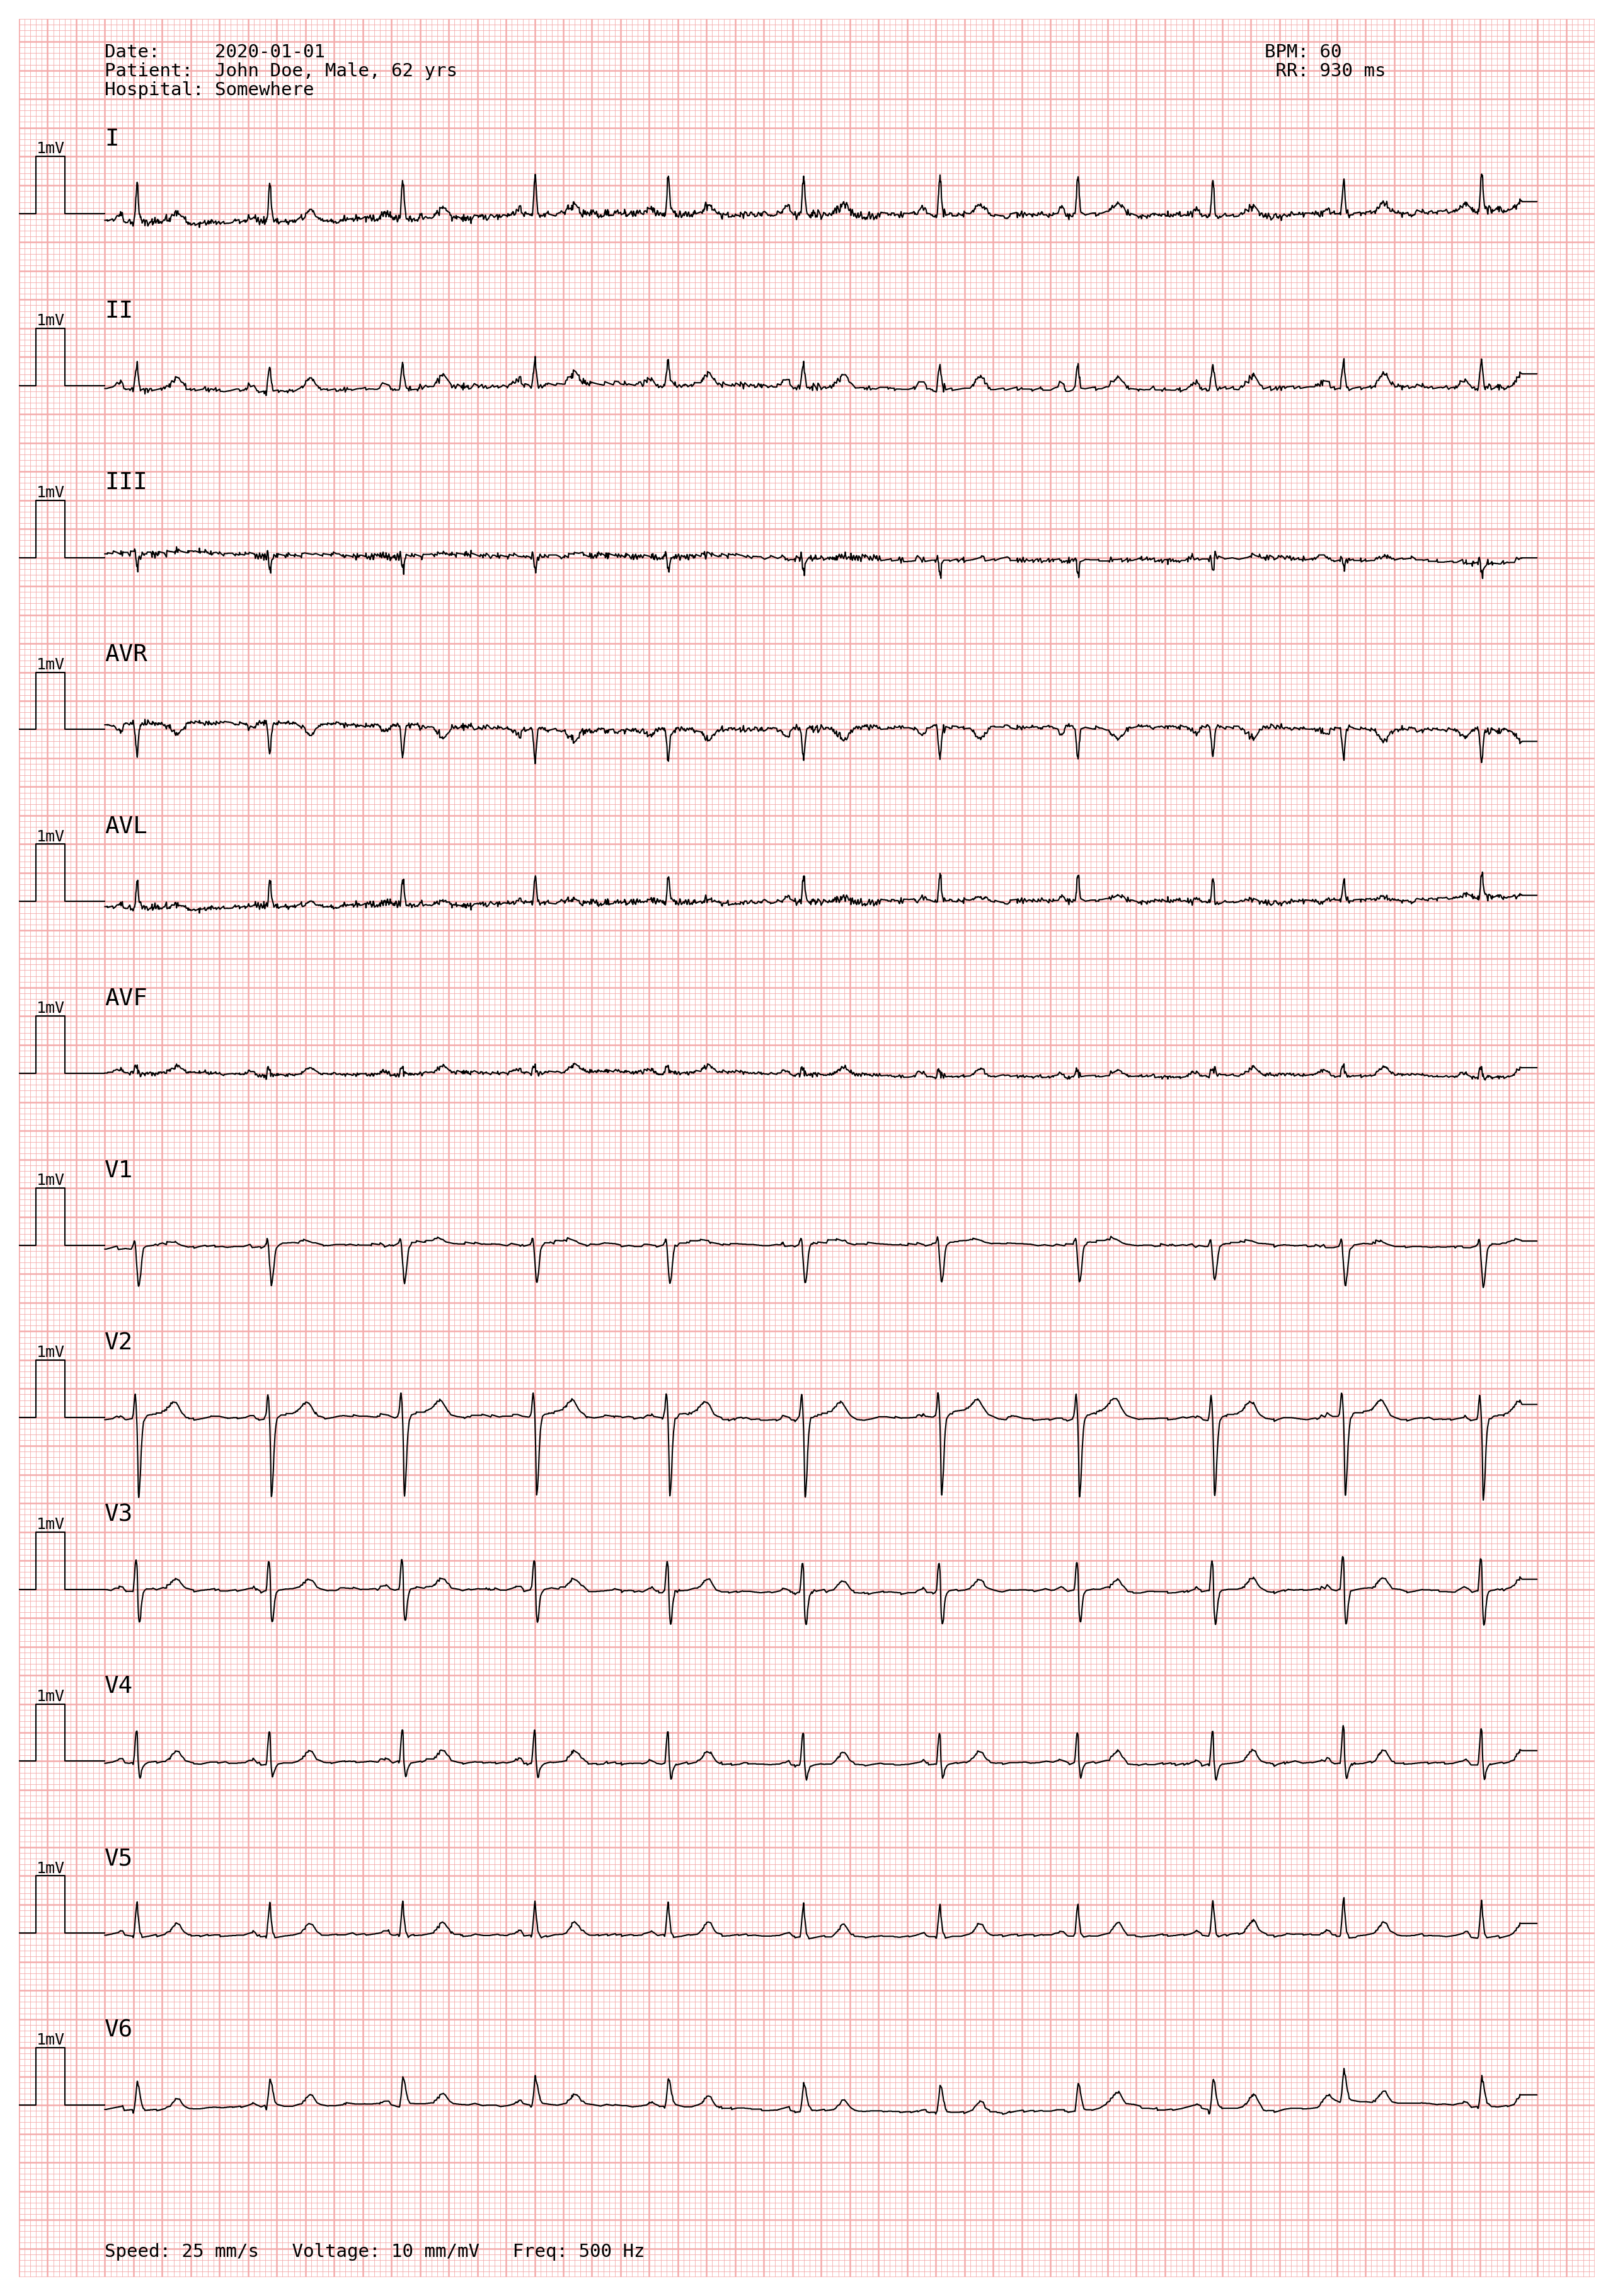
We can now print the ECG by instantiating pmecg.ECGPlotter.
import pmecg

plotter = pmecg.ECGPlotter(grid_mode='cm', print_information=True)
Note that we specify the grid mode, which by default is set to “cm”. This means that thin grid lines are plotted every \(0.1\) cm, and thicker grid lines are plotted every \(0.5\) cm. We also specify that the patient and machine information should be printed.
Now we can just pass ecg_df to plotter.plot(), together with the sampling frequency (record.fs) and the ECG Information and stats[1]
ecg_info = pmecg.ECGInformation(hospital="Somewhere",
                                patient_name="John Doe",
                                age=62,
                                sex="Male",
                                date="2020-01-01")

ecg_stats = pmecg.ECGStats(bpm=60, rr_interval_ms=930)

fig = plotter.plot(ecg_df,
                  sampling_frequency=record.fs,
                  information=ecg_info,
                  stats=ecg_stats,
                  show=True)